Minutes of Detector Characterization
Teleconference
(December 10, 2004)
Present:
Caltech: Duncan Brown, Peter Shawhan, John Zweizig
CSUDH: Ken Ganezer
Florida: Sergey Klimenko
LHO: Mike Landry, Fred Raab, Rick Savage, Robert Schofield
Louisiana Tech: Natalia Zotov
Loyola: John Whelan
LSU: Alex Dietz, Gaby Gonzalez
Michigan: Vladimir Dergachev, Keith Riles
MIT: Peter Fritschel
Oregon: Rauha Rahkola
Syracuse: Alessandra DiCredico
E11 Investigations:
- Calibrations (Mike Landry, Gaby Gonzalez, Brian O'Reilly)
Final E11 calibration point functions are available, but the
SenseMonitor
alpha/beta trends need to be regenerated for better precision. The H2
calibration
was redone at the end of the run, following a fix of photodiode
saturation.
- Glitches
(Katherine Rawlins, Laura Cadonati, Erik Katsavounidis)
Katherine summarized glitch group work on E11 triggers. She has tried
looking
at loud triggers reported by the online excess power ETG. Many can be
explained
by lock losses or the rogue dust monitor (early part of the run). Two
triggers
coincide with airplanes, but there may be no causal relationship. She
also
looked at CorrPower triggers and found one extreme outlier which too
coincided
with an airplane. Again, causality is not obvious. Much discussion
ensued
on indirect ways the plane could have caused a series of glitches and
other
artifacts seen in auxiliary channels during the interval containing the
CorrPower
trigger. Lindy Blackburn has looked at the significance distribution of
KleineWelle
triggers for each day of the run and finds the expected improvement in
H1
behavior after day 2. The distributions for H2 are less clear cut, with
some
apparent degradation late in the run. For both IFO's, the distributions
look
much better than for the S3 run. Natalia Zotov has been studying
correlations
of glitches seen by PTMon on AS_Q and auxiliary channels.
- Environmental Disturbances (Robert Schofield)
Robert first described a couple of problems found by David Strom while
on
scimon shift. 1) the infamous dust monitor left on during the first two
days
near the H2 dark port table and 2) a 260 Hz peak in H2 correlated with
the
radio PEM channel. The source of the latter was later shown to be a
mistuned
modulation frequency that led to 260 Hz beats.
Since E11, Robert has been trying to understand large variations in
apparent
acoustic coupling strength to the IFO AS_Q channels. For example, why
do
relatively smooth airplane noise levels lead to glitchiness? He has
found
that coupling at the REFL port varies by a factor of five, with
variations
correlated with drops in arm power as small as 2%. Robert is also
studying
magnetic & acoustic couplings at the AS_Q photodetector demod
boards.
- Other burst group studies -
Trigger distributions (Alessandra Di Credico)
Alessandra has tried looking at various distributions associated with
the online excess-power triggers. She finds that most triggers have
unphysically long durations, although their peak times often do
coincide with an identifiable glitch in AS_Q. The frequency
distribution peaks near the upper limit of the search band, suggesting
a filtering problem. Some of confidence levels / significances of
reported triggers are also unphysical. Kipp Cannon and Saikat Majumder
will be rerunning over the E11 data after tracking down the current
problems.
- Pulsar group studies -
Quarter-Hz lines? (Vladimir Dergachev)
Vladimir tried looking in the E11 H1 data for the same 0.25 Hz comb
seen in the S2 and S3 runs. Because the E11 run is much shorter than S2
or S3, he didn't expect to see a strong effect and doesn't. But there
is some evidence from folding the spectrum on itself in 0.25 Hz bands
over the run that there is an excess of power at 0.25 Hz harmonics. In
addition, there is also evidence of structure with 1/16 Hz and 1/8 Hz
folding, as well as for 0.53 Hz folding (suggested earlier by Robert).
- Stochastic group studies - H1-H2
coherence (Peter Fritschel)
Peter reported that although the Stochastic Group's automated machinery
is not quite ready for looking at E11 data, he did try running the DTT
on the longest double-coincidence lock stretch from the run, computing
a 10,000-average coherence estimate (0.25 Hz bins). The expected level
of coherence from uncorrelated noise is about 1.E-4 for this number of
averages. Most of the 40-500 Hz band looks consistent with no
correlation, but there are anomalies near 55 Hz (Robert suggested
compressors), 59 Hz (Robert suggested chiller compressors), just below
180 Hz (Robert thinks not a
3rd harmonic of 59 Hz), 221 Hz (PSL periscope likely), and near 267 Hz
and 280 Hz (not understood). The sidebands on 120 Hz and 180 Hz due to
stack mode resonances look much better than in S3.
- Data Quality (John Zweizig, Peter Shawhan, Keith Riles)
John has started an E11
investigations web page and started looking at DMT trends
from the run. Peter will be compiling all lock losses and 10-second
intervals preceding lock loss to make DQ flags. Keith has begun
compiling other DQ info and hopes to get a version 1 DQ segments
release out next week.
DMT Software Status:
- John Zweizig: Infrastructure
status
John has fixed a problem that caused spurious linefeeds to fill up the
common log file used by online DMT monitors.
- Patrick Sutton: Calibration infrastructure
John reported on Patrick's behalf that the EasyCalibrate E11
calibration files were regenerated and that SenseMonitor has been fixed
to once again return calibration line amplitude seen in AS_Q.
- John Whelan / Mark Cenac / Brian O'Reilly: StochMon
John reported that they are trying now to implement EasyCalibrate, but
have had trouble getting DMT version 2.10 up and running under linux.
- Ken Ganezer: seis_blrms
The new version of seis_blrms was tested during E11, and data dropouts
seemed to be correctly flagged. Working now on flagging the filter
ringdown period following a data dropout. Will work next on a circular
buffer to avoid losing strip chart history in DMT viewer when monitor
is restarted.
- Sergey Klimenko: BurstMon
Looking at detection sensitivity estimates. For ideal Gaussian noise,
expect ratio of hrss_50% to spectral strain density to be about 5.5 and
observe 7-8 for E11 data which is not too different from S2. Don't yet
understand floating point underflows that seem to bog the program down.
(JohnZ is helping to track it down.)
- Giovanni Santostasi: PulsarMon
Giovanni reported by e-mail that he is trying to understand why DMT
viewer objects get garbled in the online but not offline version of his
program.
- Rauha Rahkola: SuspensionMon
No report.
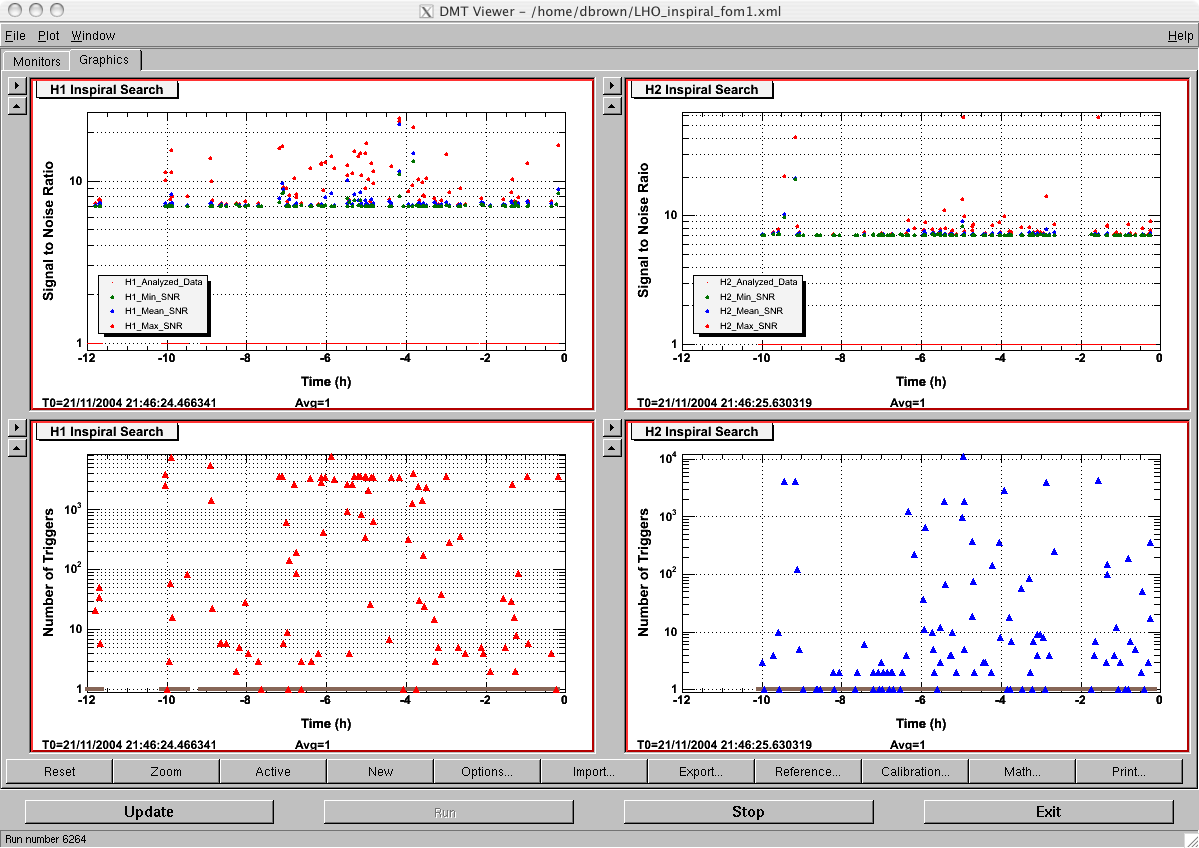
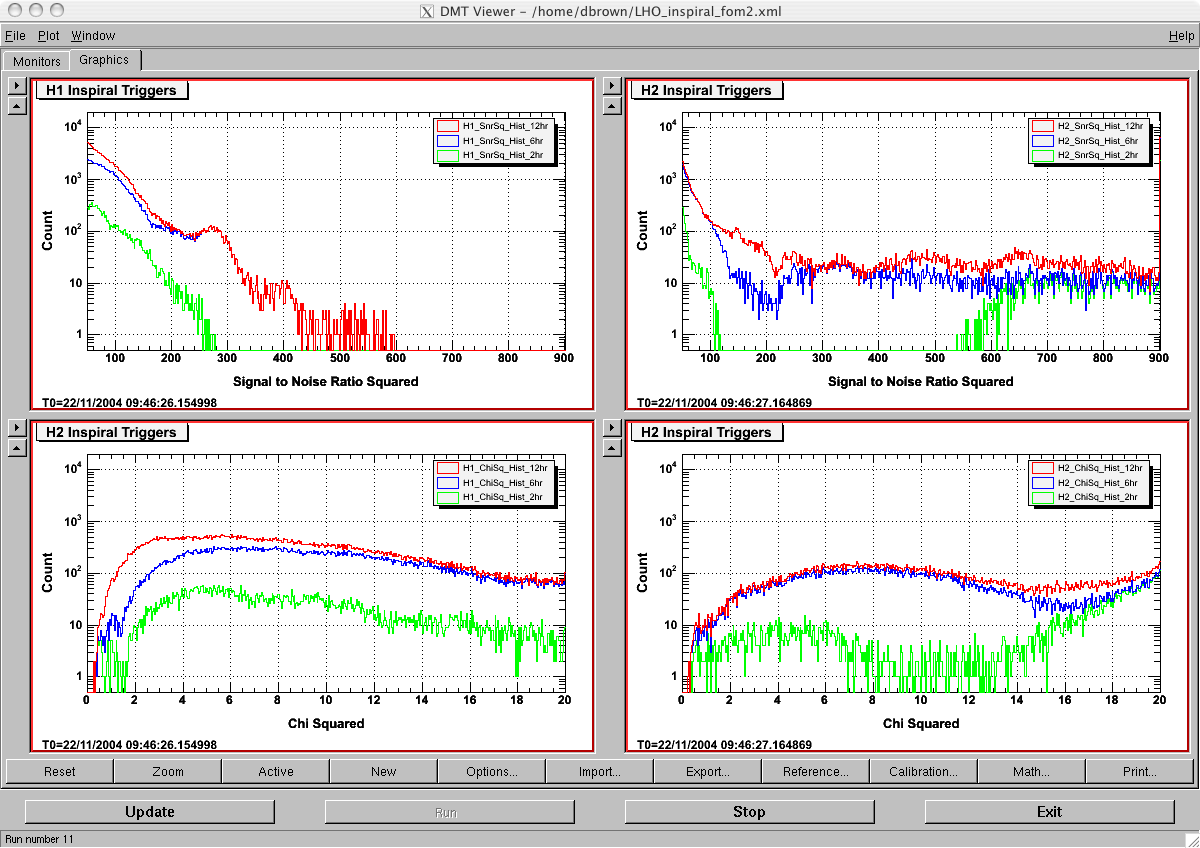
- Duncan Brown: InspiralMon ( note from Duncan
, sample FOM files: plot1
plot2
xml1
xml2
)
Duncan is working on a server system to provide xml files from online
search code to DMT monitors that can display results to the DMT viewer.
He showed sample plots from E11 based on the inspiral monitor, where
the DMT code displaying the results is known as InspiralMon. At the
moment, the latency can be as large as 2048 seconds, but Duncan is
working to shorten it. KR suggested providing frequency information
about inspiral triggers to give people in the control room guidance on
artifacts that cause high inspiral rates. Duncan will come up with a
scheme to mark clearly on displays which time intervals have not yet
been analyzed, to avoid confusion.